



SportsPicks
Politics • Investing & Finance • Sports
All your sports information for those investing Vegas-style in the outcomes of sports games. Predicting games against the line in all sports, especially football, American and English style.
Interested? Want to learn more about the community?
Crick's Corner: NFL Divisional Round Eagles vs Giants

These are not Sportspicks "Recommended Picks"

Giants vs Eagles

8:15 PM EST Saturday

How They Got Here

New York:

  • The Giants have been a pleasant surprise all season long, highly outperforming pre-season expectations. New York went 9-7-1 in the regular season, securing the #6 seed in the NFC Playoffs. That set up a Wild-Card match-up at the Minnesota Vikings. In that game, Daniel Jones became the first QB in NFL history to throw for 300+ yards and 2+ TD's while also rushing for 70+ yards. He was 24 of 35 for 301 yards and 2 TD's and had 17 carries for 78 yards in New York's 31-24 win. Saquon Barkley added 53 yards on 9 carries with 2 TD's on the ground while catching 5 passes for an additional 56 yards. Isaiah Hodgins led the Giants in receiving with 8 catches for 105 yards and a TD. Darius Slayton also added 4 receptions for 88 yards vs Minnesota.

Philadelphia:

  • The Eagles finished the regular season 14-3, and secured the #1 seed and first round bye in the NFC Playoffs. They defeated the Giants twice in the regular season, including a 22-16 win in Philly in Week 18. A win that locked up the #1 seed, as well as the NFC East Title. There are major questions surrounding QB Jalen Hurts and his health entering the playoffs. For the last month, Hurts has been nursing a shoulder injury that caused him to miss two games. The Eagles lost both games in which Hurts was sidelined. He's the best player on an ultra-talented team, but if he has to come out of a game for any reason, this team takes a MAJOR step back.

By The Numbers

New York:

  • New York was excellent in the Red-Zone on both sides of the ball this season. They scored TD's on 63.3% (7th) of their trips to the Red-Zone, while allowing TD's on just 49.2% (5th) of opponent drives that reached the scoring area. The defense was exceptional on 3rd downs, with an opponent 3rd Down conversion rate of just 35.1%. However, they struggled mightily on 4th Downs on the defensive side of the ball. Opponents converted 4th Downs on 64.7% of their attempts against the Giants in 2022.

Philadelphia:

  • The Eagles were top-tier on both sides of the ball in 2022. On Offense, they ranked 3rd in the league in points scored (28.1 ppg) and 3rd in yards gained (389.1 ypg). On Defense, they were 8th in points allowed (20.2 ppg), and 2nd in yards allowed (301.5 ypg). They've only turned the ball over on offense 19 times (4th), while forcing 27 takeaways (5th) on defense. The Eagles have the most rushing TD's in the league in 2022 with 32. Philadelphia's offense is also Top 5 in 3rd conversion rate (45.9%, 4th) and 4th down conversion rate (68.8%, 4th).

Key Match-Up

Daniel Jones vs The Eagles Secondary

  • Philadelphia's defense allowed the fewest pass yards per game in the NFL in 2022 (178.9 ypg). They were also #1 in opponent net yards per attempt (4.9). Jones threw for 3,205 yards with 15 TD's and 5 INT's in the regular season which is certainly respectable, but isn't on an elite level by any means. However, last week vs the Vikings in the Wild-Card Round, Jones threw for 301 yards and 2 TD's. Looking like the top-shelf QB the Giants drafted him to be. If New York is going to have a chance in this one, they'll need their signal-caller clicking on all cylinders the way he was last week in Minnesota. If he struggles, I don't believe the Giants defense can slow the Eagles offense down enough to keep them in this one.

From a Gambling Standpoint

New York:

  • New York is 14-4 ATS in 2022 (6-3-0 Home, 8-1-0 Away). The Over has hit in Giants games 8 times, while the Under has hit 9 times with 1 Push on "Totals" this season.

  • New York is 17-5 ATS and 14-8 outright as a playoff underdog in the Super Bowl Era.

Philadelphia:

  • The Eagles are 8-9 ATS in 2022 (6-3-0 Home, 2-6-0 Away). As for Totals, the Over has hit 10 times, while the Under has hit 7 times in Philadelphia games this season.

Trends

  • Giants are 5-0 ATS in last 5 games overall.

  • Giants are 5-0 ATS in last 5 Saturday Games.

  • Giants are 5-0 ATS in last 5 Road Games.

  • Giants are 10-2 ATS in last 12 Playoff Games.

  • Giants are 10-1 ATS in last 11 Road Playoff Games.

  • Eagles are 5-0 ATS in last 5 Divisional Playoff Games.

  • Eagles are 0-4 ATS in last 4 Games overall.

  • Eagles are 0-5 ATS in last 5 Games in January.

  • Eagles are 1-5 ATS in last 6 Saturday Games.

  • Eagles are 5-2 ATS in last 7 Playoff Games.

  • Road Team is 7-3 ATS in last 10 Heads-Up Meetings.

  • Under is 4-1 in last 5 meetings in Philadelphia in this series.

  • Giants are 5-1 ATS in last 6 meetings in Philadelphia.

Prediction

  • This game, to me, boils down to the health of Jalen Hurts. If he can play the entire game, and at the MVP-caliber level that he has played at all season, I'm not sure the Giants defense will be able to stop the Eagles enough on offense to win this one. However, Hurts has struggled vs the Giants in his career, more so than any other opponent that he has faced multiple times. If Daniel Jones can put up another performance like he had last week vs the Vikings, it puts this Giants offense on another level. I believe this one is going to be a hard-hitting, smash-mouth football game, with multiple lead changes throughout. I think the difference in this one will be New York's fantastic Red-Zone defense that has kept them in games that they didn't belong all season. They get a late Red-Zone stop to keep them in it, and Danny Dimes leads a "Drive for the Ages" to win this in the final minutes!!

Final Score: New York 24 Philadelphia 23

Enjoy the Game!!!!

-Crickett

Interested? Want to learn more about the community?
What else you may like…
Videos
Podcasts
Posts
Articles
Barnes Brothers: European Soccer MEGA Preview
01:08:49
Barnes Brothers: World Cup Final Preview
00:46:09
World Cup Final Preview: Barnes Brothers

Enjoy before the big finale on Sunday.

00:46:09
SEC Preview Podcast

A full breakdown of every team in the SEC, including talent analysis, coordinator concern, and schedule forecasts, with win total expectations. Enjoy!

SEC Preview Podcast
Smokehouse Mike's NCAAB

March Madness final four recap and Championship preview...

Smokehouse Mike's NCAAB
Smokehouse Mike's NBA
LIVE CHAT FOR 2026

Now open!

⚾🔥 MLB NRFI PLAY OF THE DAY

🎯 NEW YORK YANKEES @ SAN DIEGO PADRES
⚾ NRFI — No Run 1st Inning
📊 Model Projection: 68.34
🏆 #1 ranked NRFI on today's slate

Carlos Rodón vs. Robbie Ray

🔥 Rodón: 8-4 NRFI / 5-2 road
🔥 Ray: 22-4 NRFI / 12-2 home
🔥 Ray riding 9 straight NRFIs
📊 Pitching Grade: 69.47
📊 Team NRFI Grade: 74.93
🏟️ Favorable Petco Park environment

⚠️ Rodón's recent return from injury is worth noting, but he's pitched well since returning — and we're only asking him for the first three outs.

Six outs. No runs. ⚾🚫

post photo preview
Forecasting the Senate in 2026

Two conflicting trends dictate the Senate outcome in 2026. The map heavily favors Republicans, as the competitive Senate seats up lean heavily Republican. By contrast, the election context heavily favors Democrats, with war, recession, realignment and scandal tipping in their direction. A deeper dive reveals why prediction markets still likely undersell Democratic prospects.

First, the idea that Senate midterms favor the party out of power in the White House is belied by both recent and a century of history of Senate elections. Unlike the House, only a third of Senate seats face election in any midterm, and that map dictates outcomes unless the election context is particularly bad for the incumbent party.

Consider that the highly unpopular Biden didn’t lost any net Senate seats in 2022 and Trump added Senate seats in the Democratic friendly cycle in 2018. Equally, Clinton didn’t lose net Senate seats in 1998 nor did W. in 2002. Even low-approval election cycles like 1966 and 1982 didn’t produce a big swing in the Senate. Indeed, since 1934, the party in power only lost 10% or more of their Senate seats (4+) less than half of the time. Democrats need a flip of exactly that — at least 4 Senate seats — to retake power in the Senate.

Then take a look at the map, and you can see the reason for optimism in GOP circles and some traders in the prediction markets. Only 2 GOP-held seats are in states Trump won by less than double digits, while 2 Democratic-held seats are in states Trump won, and one of those GOP held seats features a long-time incumbent who typically runs double-digits ahead of the GOP norm (Collins in Maine). This is why the GOP entered the year believing odds of losing the Senate were remote, and the prediction markets mostly concurred.

But this ignores the counter-trend: the degree of election dismay with the incumbent party in the White House, and the reasons for that dismay. Presidential job approval has not been a neat proxy for Senate midterms because it depends on the reason for that dissatisfaction in the electorate. Four factors drive Senatorial midterms: war, recession/cost of living, realignment, and scandal. When two of those four factors are not present and don’t dominate, then the incumbent party’s odds of losing 4+ Senate seats drops to less than 20%. By contrast, when two of those four factors are present and do predominate, then the odds of the incumbent party losing 4+ Senate seats rises to 100%. Indeed, the median number of Senate seats lost when some combination of war, recession, realignment and scandal, are present, the White House party loses at least 8 Senate seats.

A few examples: while FDR added Senate seats in 1934 midterms, he lost 9 in 1938 midterms due to the combination of recession and scandal (trying to stack SCOTUS). 1942 and 1946 gave us war and recession to cost Democrats 8 and 12 Senate seats alike. 1950 gave us war again and scandals concerning the war costing Democrats 5 Senate seats. 1958 gave us recession and scandal, costing Ike 15 Senate seats. While JFK added Senate seats in 1962 and Nixon added Senate seats in 1970, only Watergate and stagflation in 1974 or the combination of Iran Contra and vulnerable class of 1980 incumbents cost the incumbent party 4 or more Senate seats until the realignment election of 1994, where evangelicals shifted their down-ballot voting to the GOP en masse. It took war and scandal in 2006 to see the Senate switch 4+ Senate seats again.

That’s the story of 2026: a very GOP favorable Senate map versus a very Democratic friendly election cycle. The GOP enters election season with all four factor present: war, recession/cost of living, realignment, and scandal. The Iran War was already deeply unpopular, and it’s impact on the economy in gas and diesel prices turns Americans sour on their current economic prospects, as wages fall behind, housing and health care feel increasingly unaffordable, labor force participation continues to drop, the the mirage of AI keeps the GDP just above a technical recession. The Epstein scandal remains one of the worst scandals in American political history, and Trump managed to associate himself deeply with the scandal in his handling of it. Then the realignment, as the new Trump 2024 voters joined the Obama-Trump converts of 2016 in abandoning GOP identity, already evident in surveys and primary participation.

A quintet of voter groups appear to be realigning away from the Republican brand — hispanic voters, black voters, industrial area voters, libertarian-leaning voters, and war-skeptical voters alike. This realigning electorate shows up disproportionately in key Senate contests. The war-skeptical voters in states like Maine, New Hampshire, Ohio, Michigan, Iowa, Montana, Nebraska, and Alaska (these are the states W failed to gain in between 2000 and 2004 due to the Iraq War before it even turned unpopular). The hispanic voters in states like Florida and Texas. The African-American voters in states like North Carolina and Georgia. The industrial voters in Ohio and Michigan. The libertarian leaving voters in states like New Hampshire, Alaska, Texas and Florida.

Thus, many of the states that seem “Safe” on the map are anything but, as their realigning electorates shift back against the Republican brand, with all of them having recent histories in electoral cycles of favoring Democrats or being true swing states. Take states like Florida and Texas where suburban margins began to erode for the GOP in the Trump era but countered that by massive margin shifts in hispanic and black precincts. Primary participation, voter identification, and public opinion surveys show those black and hispanic voters shifting back massively away from the GOP brand, which, given the erosion in some suburban areas and losses with younger generations, makes states Florida and Texas closer to competitive than double-digit leans.

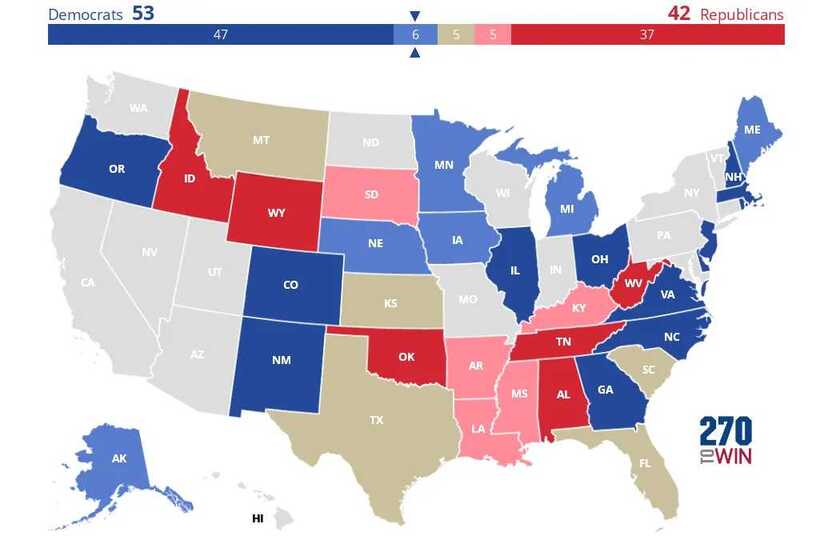
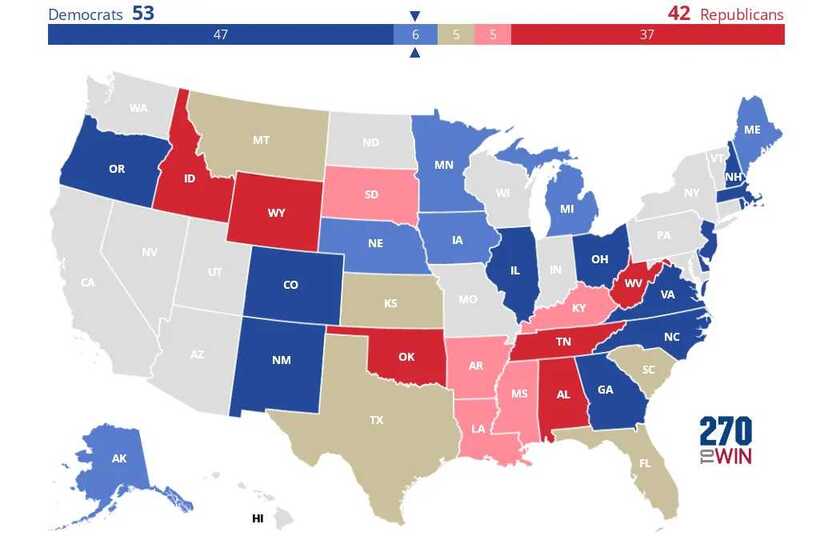
In big swing election cycles, even “safe” Senate seats can suddenly turn razor close, as Bob Dole found out in 1974, barely holding on to his Kansas seat before being the VP nominee two years later. Strong independent candidates in Kansas, Nebraska, South Dakota and Montana may pose a unique threat to GOP held seats, as the Nebraska race in 2024 showed, with Osborn running 17 points ahead of Harris’ margin in the state. Democrats field the much better candidate in Ohio with a proven track record of out-performing Democratic margins in the state, while the Texas GOP nominee faces abandonment from his own party after they spent over $100M bashing him in the state for a disliked party incumbent. Alaska primary results suggest the Democratic nominee already holds the edge in that ranked choice voting state, while the famed cross-over support for Collins in Maine appears to be fading with newer generations taking over the voter rolls. My current map would be as follows, with surprising closer-than-expected races in Montana, Kansas, Louisiana, Florida, Mississippi, South Dakota, South Carolina and Kentucky, and a median map of Democrats holding 53+ Senate seats after the 2026 elections.


If past is prologue, the map won’t save the GOP in 2026, and an ever bigger tsunami may be incoming than anyone in Washington expects.

Read full Article
post photo preview
OFFICIAL PICKS: Midterms, 2026
House Elections Projections
 
The House tends to be more responsive to midterm dynamics, but, like the Senate, swings hard in elections where some combination of the Four Factors are present -- cost of living crisis or recession; war; major scandal; betrayal or down-ballot realignment. A fun map to use is this simulator, which takes partisan averages from existing models, and plugs in the map based on your adjustment of the generic ballot edge for one party or another. https://globalelectionsimulator.com/#/usa-house
 
Historic Norms: When a combination of the Four Factors are present, this is the kind of swing you get:
1930: 52 seat swing
1946: 55 seat swing
1958: 49 seat swing
1974: 49 seat swing
1994: 54 seat swing
2006: 31 seat swing
 
2026 PROJECTIONS


Only for Supporters
To read the rest of this article and access other paid content, you must be a supporter
Read full Article
post photo preview
Barnes Betting Report: Senate 2026

First, four factors dictate whether there is major turnover in the Senate in a midterm election independent of the favorability of the Senate map (due to only one-third of seats being up in any given midterm). Often, as was the case in both 2018 and 2022, is that incumbents are not destined to lose seats, outside of realigning elections in unfavorable maps. This cycle's map favors the GOP, which is why the prediction markets and most forecasters expect a GOP majority in the 2027 Senate. The four factors that prove dangerous to the incumbent party are: first, a recession or cost of living crisis; second, a war; third, a major scandal; and fourth, a sense of betrayal in the voter group that backed the incumbent amongst some portion of their prior electoral coalition. Five midterms feature some combingation of those factors in some significant degree: 1930, 1946, 1958, 1974 and 2006.

Without those factors present in multiple forms, the incumbent party can expect to hold on to seats in states it previously won outside the national margin. When those factors are present, the landscape shifts dramatically. Examining those White House incumbent seats that showed a state-wide election decided by single digits in the prior decade produces the following probabilities: the incumbent White House party lost at least 67% of its incumbent held seats, as much as 85% of its incumbent held seats, and an average of 75% of its incumbent hold seats, rarely upsetting the opposition party in any seat and often losing a surprise or two in seats considered completely safe. 


Only for Supporters
To read the rest of this article and access other paid content, you must be a supporter
Read full Article
See More
Available on mobile and TV devices
google store google store app store app store
google store google store app tv store app tv store amazon store amazon store roku store roku store
Powered by Locals