NBA PREVIEW March 1st
CHA travels to PHI as an 11.5 point favorite with a total of 213.5
CHA’s M. Williams and Ball are out. G.Williams is a game time decision.
PHI’s Oubre, Martin are game time decisions. Melton, Embiid and Covington are out.
Early public action shows 74% lean toward CHA and 88% favor the under.
CLE travels to DET as an 8.5 point fave with a total of 221.5
CLE’s Thompson and Jerome are out. Mitchell and LaVert are game time decisions.
DET’s Sasser is out.
Early public action shows 81% lean toward DET and 71% favor the under.
DAL travels to BOS as an 8.5 point dog with a total of 237.5
DAL’s Luka is a game time decision. BOS’s Brissett is a game time decision.
Early public action shows 64% lean toward DAL and 58% favor the under.
GS travels to TOR as a 3.5 point favorite with a total of 235.5
GS”s Wiggins is out. Santos and Podziemski is a game time decision.
TOR’s Nowell and Boucher are game time decisions.
Early public action shows 77% lean toward GS and 59% favor the over.
POR travels to MEM as a 1.5 point dog with a total of 207.5
POR’s Sharpe, Brogdan are out. Brown and Ayton are game time decisions.
MEM’s Smart, Rose,Pippen,J. Jackson, Clarke and Bane are out.
G. Jackson,Kennard,Conchar are game time decisions.
Early public action shows 57% lean toward POR and 59% favor the under.
IN travels to NO as a 5.5 point dog with a total of 238.5
IN’s Nesmith is a game time decision. McDermott is out. NO’s Daniels is out.
Early public action shows 69% lean toward NO and 82% favor the over.
SAC travels to MN as a 6.5 point dog with a total of 224.5
SAC’s Vezenkov is out. Fox is a game time decision. MN’s Edwards and Anderson are GTD.
Early public action shows 62% lean toward MN and 57% favor the over.
MIL travels to CHI as a 4.5 point favorite with a total of 222.5
MIL’s Middleton is out. Giannis is a game time decision.
CHI’s Craig is out and Caruso is a game time decision.
Early public action shows 66% lean toward MIL and 94% favor the under.
WSH travels to LAC as a 16.5 point dog with a total of 238.5
WSH’s Coulibaly and Ball are game time decisions.
LAC’s Zubac and George are game time decisions
Early public action shows 65% lean toward LAC and 60% favor the under.
NCAAM TOP 25 PREVIEW March 1st
#21 DAY travels to L-IL as a 1.5 point favorite with a total of 137.5
Early public action shows 69% lean toward Loyola and 52% favor the over.
Air Force travels to #22 UT ST as a 16.5 point dog with a total of 136.5
AF’s Mills is a game time decision. Green is out.
Early public action shows 94% lean toward UT ST and 66% favor the over.

In this edition of "Master Class", we're gonna look at Prediction Markets vs Sportsbooks, and why the Prediction Markets are the Future of Sports Betting!! Come join us, as we try to provide you with all the tools to STACK YOUR NICKELS TO THE CEILING!! Feel Free to drop any questions you have in the comments!! Hope This Helps My Friends!! Good Luck, Good Gamblin, & Have The Day You Deserve!!
-Crickett
MLB
2% ATL 49% Phillies (ok to 50%)
2% WSX 42% Astros (ok to 45%)
2% BOS 45% Yankees (ok to 46%)
Barnes turned a bunch of us on to Josh Pate podcast last season. I like Pate’s show, but I don’t always have an hour every few days to sit down and watch the whole thing. So I built myself a little AI bot that goes through each new Pate show and gives me the useful parts, actual picks, leans, best bets, team opinions that changed, and where he disagrees with his own model. It also tries to separate a real pick from Pate just talking through a game, because those can sound pretty similar if you’re skimming.
Thought I’d share the rundowns here occasionally in case anybody else finds them useful. It’s not meant to replace the show, just the “I don’t have 64 minutes tonight” version.
Josh Pate's - Week 5 quick rundown
Ramenoodle Express:
Michigan State +10.5
Cincinnati +7.5
Florida–Missouri Over 56.5 — new this week / his strongest new play
Other actual picks:
Ohio State -13.5 at Iowa
Virginia Tech -3.5 vs Pitt
Leans / opinions:
Alabama -5.5 at Mississippi State — likes Bama despite his own...
Two conflicting trends dictate the Senate outcome in 2026. The map heavily favors Republicans, as the competitive Senate seats up lean heavily Republican. By contrast, the election context heavily favors Democrats, with war, recession, realignment and scandal tipping in their direction. A deeper dive reveals why prediction markets still likely undersell Democratic prospects.
First, the idea that Senate midterms favor the party out of power in the White House is belied by both recent and a century of history of Senate elections. Unlike the House, only a third of Senate seats face election in any midterm, and that map dictates outcomes unless the election context is particularly bad for the incumbent party.
Consider that the highly unpopular Biden didn’t lost any net Senate seats in 2022 and Trump added Senate seats in the Democratic friendly cycle in 2018. Equally, Clinton didn’t lose net Senate seats in 1998 nor did W. in 2002. Even low-approval election cycles like 1966 and 1982 didn’t produce a big swing in the Senate. Indeed, since 1934, the party in power only lost 10% or more of their Senate seats (4+) less than half of the time. Democrats need a flip of exactly that — at least 4 Senate seats — to retake power in the Senate.
Then take a look at the map, and you can see the reason for optimism in GOP circles and some traders in the prediction markets. Only 2 GOP-held seats are in states Trump won by less than double digits, while 2 Democratic-held seats are in states Trump won, and one of those GOP held seats features a long-time incumbent who typically runs double-digits ahead of the GOP norm (Collins in Maine). This is why the GOP entered the year believing odds of losing the Senate were remote, and the prediction markets mostly concurred.
But this ignores the counter-trend: the degree of election dismay with the incumbent party in the White House, and the reasons for that dismay. Presidential job approval has not been a neat proxy for Senate midterms because it depends on the reason for that dissatisfaction in the electorate. Four factors drive Senatorial midterms: war, recession/cost of living, realignment, and scandal. When two of those four factors are not present and don’t dominate, then the incumbent party’s odds of losing 4+ Senate seats drops to less than 20%. By contrast, when two of those four factors are present and do predominate, then the odds of the incumbent party losing 4+ Senate seats rises to 100%. Indeed, the median number of Senate seats lost when some combination of war, recession, realignment and scandal, are present, the White House party loses at least 8 Senate seats.
A few examples: while FDR added Senate seats in 1934 midterms, he lost 9 in 1938 midterms due to the combination of recession and scandal (trying to stack SCOTUS). 1942 and 1946 gave us war and recession to cost Democrats 8 and 12 Senate seats alike. 1950 gave us war again and scandals concerning the war costing Democrats 5 Senate seats. 1958 gave us recession and scandal, costing Ike 15 Senate seats. While JFK added Senate seats in 1962 and Nixon added Senate seats in 1970, only Watergate and stagflation in 1974 or the combination of Iran Contra and vulnerable class of 1980 incumbents cost the incumbent party 4 or more Senate seats until the realignment election of 1994, where evangelicals shifted their down-ballot voting to the GOP en masse. It took war and scandal in 2006 to see the Senate switch 4+ Senate seats again.
That’s the story of 2026: a very GOP favorable Senate map versus a very Democratic friendly election cycle. The GOP enters election season with all four factor present: war, recession/cost of living, realignment, and scandal. The Iran War was already deeply unpopular, and it’s impact on the economy in gas and diesel prices turns Americans sour on their current economic prospects, as wages fall behind, housing and health care feel increasingly unaffordable, labor force participation continues to drop, the the mirage of AI keeps the GDP just above a technical recession. The Epstein scandal remains one of the worst scandals in American political history, and Trump managed to associate himself deeply with the scandal in his handling of it. Then the realignment, as the new Trump 2024 voters joined the Obama-Trump converts of 2016 in abandoning GOP identity, already evident in surveys and primary participation.
A quintet of voter groups appear to be realigning away from the Republican brand — hispanic voters, black voters, industrial area voters, libertarian-leaning voters, and war-skeptical voters alike. This realigning electorate shows up disproportionately in key Senate contests. The war-skeptical voters in states like Maine, New Hampshire, Ohio, Michigan, Iowa, Montana, Nebraska, and Alaska (these are the states W failed to gain in between 2000 and 2004 due to the Iraq War before it even turned unpopular). The hispanic voters in states like Florida and Texas. The African-American voters in states like North Carolina and Georgia. The industrial voters in Ohio and Michigan. The libertarian leaving voters in states like New Hampshire, Alaska, Texas and Florida.
Thus, many of the states that seem “Safe” on the map are anything but, as their realigning electorates shift back against the Republican brand, with all of them having recent histories in electoral cycles of favoring Democrats or being true swing states. Take states like Florida and Texas where suburban margins began to erode for the GOP in the Trump era but countered that by massive margin shifts in hispanic and black precincts. Primary participation, voter identification, and public opinion surveys show those black and hispanic voters shifting back massively away from the GOP brand, which, given the erosion in some suburban areas and losses with younger generations, makes states Florida and Texas closer to competitive than double-digit leans.
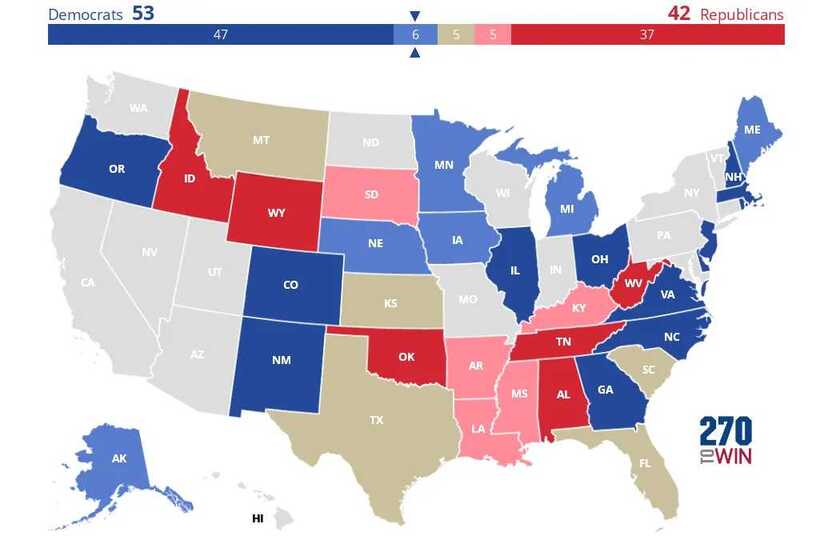
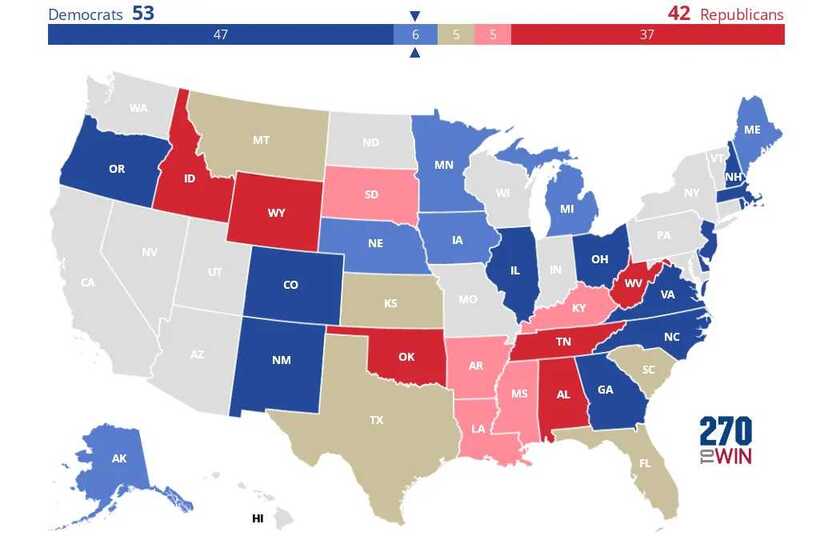
In big swing election cycles, even “safe” Senate seats can suddenly turn razor close, as Bob Dole found out in 1974, barely holding on to his Kansas seat before being the VP nominee two years later. Strong independent candidates in Kansas, Nebraska, South Dakota and Montana may pose a unique threat to GOP held seats, as the Nebraska race in 2024 showed, with Osborn running 17 points ahead of Harris’ margin in the state. Democrats field the much better candidate in Ohio with a proven track record of out-performing Democratic margins in the state, while the Texas GOP nominee faces abandonment from his own party after they spent over $100M bashing him in the state for a disliked party incumbent. Alaska primary results suggest the Democratic nominee already holds the edge in that ranked choice voting state, while the famed cross-over support for Collins in Maine appears to be fading with newer generations taking over the voter rolls. My current map would be as follows, with surprising closer-than-expected races in Montana, Kansas, Louisiana, Florida, Mississippi, South Dakota, South Carolina and Kentucky, and a median map of Democrats holding 53+ Senate seats after the 2026 elections.

If past is prologue, the map won’t save the GOP in 2026, and an ever bigger tsunami may be incoming than anyone in Washington expects.