Well Folks... We FINALLY put together a MONSTER DAY yesterday!! I don't really know what to say beyond that, other than... WE LOVE IT WHEN A PLAN COMES TOGETHER!! The Gambling Gods were KIND TO US, as we ended the night PROFITABLE in all 3 Sports, and we were UP at least a couple Units in each category!! If that don't get ya a little FIRED UP... Ya might wanna CHECK YOUR PULSE cause it had me GIDDY like a kid on Christmas Mornin!! We've got another SOLID SLATE across the Sportsverse Today, and hopefully an ENCORE is in store!! Once again... WHAT COULD GO WRONG!! You & Your Beautiful Families STAY SAFE Out There!!! Good Luck & Good Gamblin!!!!
TUNE IN for "Crick's Corner" at 3:00 PM EST (Monday - Friday) over on the "Sportspicks" Channel on Rumble!! Hope To See Y'all There!!!!
ATS = Against The Spread
ML = MoneyLine
ALT = Alternate Spreads
SGP = Same Game Parlay
TT = Team Total
IPP = Individual Player Props
PL (Puck Line) = -1.5/+1.5 Goals (Hockey)
RL (Run Line) = -1.5/+1.5 Runs (Baseball)
NRFI = No Runs First Inning (Baseball)
YRFI = Yes Runs First Innings (Baseball)
1/2 Unit = .5 Units (50% Unit)
1/4 Unit = .25 Units (25% Unit)
SPRINKLE = At Your Discretion (DON'T GO CRAZY!!)
THESE ARE NOT SPORTSPICKS "OFFICIAL PICKS"
ALL MY ODDS COME FROM DRAFTKINGS
Crick's Picks Results: NHL, NBA, & MLB (4/25/25) / YTD
4/25/25
NHL
1-0 (2-Unit Plays)
2-1 (1-Unit Plays)
NHL (4/25/25) Overall = +5.06 Units
NBA
2-1 (1-Unit Plays)
NBA (4/25/25) Overall = +2.34 Units
MLB
The Baltimore Orioles/Detroit Tigers & Boston Red Sox/Cleveland Guardians Games were Postponed Yesterday (Weather), so those results obviously won't be reflected on our record.
Also, The Red Sox/Guardians Game was the 3rd Leg of our "NRFI Parlay"... With the game being postponed, The NRFI Parlay became a "2-Legger" with Odds at +291... Divide that by 2... And our profit for Yesterday's NRFI was +1.45 Units.
3-3 (1-Unit Plays)
1-0-1 (1-Unit Plays)
1-0 (1/2-Unit Plays)
0-1 (1/2-Unit Plays)
MLB (4/25/25) Overall = +4.66 Units
NHL, NBA, & MLB (4/25/25) Overall = +12.06 Units
Year To Date
NHL
7-6 (2-Unit Plays)
136-183 (1-Unit Plays)
6-16 (1/2-Unit Plays)
Playoff Results
These Results Have Already Been Factored Into The YTD Results... This Section Is Simply To Track Our Playoff Results, Individually, As Well.
1-1 (2-Unit Plays)
8-12 (1-Unit Plays)
1-0 (1/2-Unit Plays)
NHL Playoffs To Date = +.33 Units
NHL Year To Date = -14.11 Units
NBA
5-1 (3-Unit Plays)
25-25 (2-Unit Plays)
56-36 (1-Unit Plays)
1-1 (2-Unit Plays)
7-12 (1-Unit Plays)
1-2 (1/2-Unit Plays)
0-1 (1-Unit Plays)
Playoff Results
These Results Have Already Been Factored Into The YTD Results... This Section Is Simply To Track Our Playoff Results, Individually, As Well.
1-1 (2-Unit Plays)
7-7 (1-Unit Plays)
0-1 (1-Unit Plays)
0-1 (1/2-Unit Plays)
NBA Playoffs To Date = +1.31 Units
NBA Year To Date = +24.39 Units
MLB
3-1 (2-Unit Plays)
40-56-4 (1-Unit Plays)
2-10 (1/2-Unit Plays)
14-17-2 (1-Unit Plays)
0-1 (1/2-Unit Play)
2-9 (1/2-Unit Plays)
3-8 (1/2-Unit Plays)
1-3 (1/2-Unit Plays)
MLB Year To Date = +2.88 Units
NHL, NBA, & MLB Year To Date (Combined) = +13.16 Units
Crick's Picks: NHL, NBA, & MLB - 4/26/25
PAY ATTENTION TO THE UNIT AMOUNT RECOMMENDED FOR EACH PICK
4/26/25
NHL (5 Picks)
Tampa Bay Lightning ML (+114) @ Florida Panthers 2-Unit Play / 1:10 PM EST
Tampa Bay Lightning -1.5 (+275) @ Florida Panthers 1-Unit Play / 1:10 PM EST
Vegas Golden Knights/Minnesota Wild UNDER 5.5 (+105) 1-Unit Play / 4:10 PM EST
Ottawa Senators -1.5 (+220) vs Toronto Maple Leafs 1-Unit Play / 7:10 PM EST
Colorado Avalanche -1.5 (+140) vs Dallas Stars 1-Unit Play / 9:40 PM EST
Total Units Invested NHL (4/26/25) = 6 Units
NBA (4 Picks)
Cleveland Cavaliers/Miami Heat OVER 219.5 (+160) 1-Unit Play / 1:05 PM EST
Oklahoma City Thunder -17.5 (+117) @ Memphis Grizzlies 1-Unit Play / 3:35 PM EST
Denver Nuggets ML (+200) @ Los Angeles Clippers 1-Unit Play / 6:05 PM EST
Golden State Warriors -6.5 (+140) vs Houston Rockets 1-Unit Play / 8:35 PM EST
Total Unit Invested NBA (4/26/25) = 4 Units
MLB (10 Picks)
Detroit Tigers -1.5 (+154) vs Baltimore Orioles - Game 1 1-Unit Play / 1:10 PM EST
Cleveland Guardians -1.5 (+179) vs Boston Red Sox 1-Unit Play / 1:10 PM EST
Los Angeles Angels/Minnesota Twins OVER 9.5 (+155) 1-Unit Play / 2:10 PM EST
St. Louis Cardinals -1.5 (+136) vs Milwaukee Brewers 1-Unit Play / 2:15 PM EST
Cincinnati Reds/Colorado Rockies UNDER 9.5 (+115) 1-Unit Play / 3:10 PM EST
Texas Rangers/San Francisco Giants UNDER 7 (+127) 1-Unit Play / 4:05 PM EST
Baltimore Orioles -1.5 (+150) @ Detroit Tigers - Game 2 1-Unit Play / 6:10 PM EST
Houston Astros -1.5 (+124) @ Kansas City Royals 1-Unit Play / 7:10 PM EST
San Diego Padres -1.5 (+160) vs Tampa Bay Rays 1-Unit Play / 8:40 PM EST
Los Angeles Dodgers -3.5 (+172) vs Pittsburgh Pirates 1-Unit Play / 9:10 PM EST
NRFI/YRFI Parlays
1/2-UNIT PLAY RECOMMENDED FOR EACH OF THESE PARLAYS
NRFI (No Runs First Inning) Parlay
Boston Red Sox/Cleveland Guardians - Game 1 (-125) 1:10PM EST
Cincinnati Reds/Colorado Rockies (+105) 3:10 PM EST
Chicago White Sox/Athletics (+100) 4:05 PM EST
Total Odds Boost = +638
YRFI (Yes Runs First Inning) Parlay
Los Angeles Angels/Minnesota Twins (-110) 2:10 PM EST
Houston Astros/Kansas City Royals (+100) 7:10 PM EST
Atlanta Braves/Arizona Diamondbacks (-120) 8:10 PM EST
Total Odds Boost = +600
Total Units Invested MLB (4/26/25) = 11 Units
Total Units Invested: NHL, NBA, & MLB (4/26/25) Overall = 21 Units
THESE ARE NOT SPORTSPICKS "OFFICIAL PICKS"
Good Luck Today Folks!!!!
-Crickett

In this edition of "Master Class", we're gonna look at Prediction Markets vs Sportsbooks, and why the Prediction Markets are the Future of Sports Betting!! Come join us, as we try to provide you with all the tools to STACK YOUR NICKELS TO THE CEILING!! Feel Free to drop any questions you have in the comments!! Hope This Helps My Friends!! Good Luck, Good Gamblin, & Have The Day You Deserve!!
-Crickett
🏈 NFL Moonshot Teaser — WINNER! ✅
Panthers vs. Packers — 6/6 CASHED!
✅ Jordan Love — 225+ Passing Yards
✅ Tucker Kraft — 25+ Receiving Yards
✅ Chuba Hubbard — 40+ Rushing Yards
✅ Tucker Kraft — 4+ Receptions
✅ Christian Watson — 40+ Receiving Yards
✅ Carolina Panthers +10.5
🎯 FanDuel: +301 (30% Profit Boost)
Six legs, six winners! The Thursday Night Moonshot Teaser delivers! 💰🏈
🏈 NFL Thursday Night — Moonshot Teaser
Panthers vs. Packers
🏈 Jordan Love (GB) — 225+ Passing Yards
🏈 Tucker Kraft (GB) — 25+ Receiving Yards
🏈 Chuba Hubbard (CAR) — 40+ Rushing Yards
🏈 Tucker Kraft (GB) — 4+ Receptions
🏈 Christian Watson (GB) — 40+ Receiving Yards
🏈 Carolina Panthers +10.5
🎯 FanDuel: +301 (30% Profit Boost)
Original Odds: +231
Six-leg alternate-line moonshot. Higher risk, bigger payout!
⏳ Pending
Two conflicting trends dictate the Senate outcome in 2026. The map heavily favors Republicans, as the competitive Senate seats up lean heavily Republican. By contrast, the election context heavily favors Democrats, with war, recession, realignment and scandal tipping in their direction. A deeper dive reveals why prediction markets still likely undersell Democratic prospects.
First, the idea that Senate midterms favor the party out of power in the White House is belied by both recent and a century of history of Senate elections. Unlike the House, only a third of Senate seats face election in any midterm, and that map dictates outcomes unless the election context is particularly bad for the incumbent party.
Consider that the highly unpopular Biden didn’t lost any net Senate seats in 2022 and Trump added Senate seats in the Democratic friendly cycle in 2018. Equally, Clinton didn’t lose net Senate seats in 1998 nor did W. in 2002. Even low-approval election cycles like 1966 and 1982 didn’t produce a big swing in the Senate. Indeed, since 1934, the party in power only lost 10% or more of their Senate seats (4+) less than half of the time. Democrats need a flip of exactly that — at least 4 Senate seats — to retake power in the Senate.
Then take a look at the map, and you can see the reason for optimism in GOP circles and some traders in the prediction markets. Only 2 GOP-held seats are in states Trump won by less than double digits, while 2 Democratic-held seats are in states Trump won, and one of those GOP held seats features a long-time incumbent who typically runs double-digits ahead of the GOP norm (Collins in Maine). This is why the GOP entered the year believing odds of losing the Senate were remote, and the prediction markets mostly concurred.
But this ignores the counter-trend: the degree of election dismay with the incumbent party in the White House, and the reasons for that dismay. Presidential job approval has not been a neat proxy for Senate midterms because it depends on the reason for that dissatisfaction in the electorate. Four factors drive Senatorial midterms: war, recession/cost of living, realignment, and scandal. When two of those four factors are not present and don’t dominate, then the incumbent party’s odds of losing 4+ Senate seats drops to less than 20%. By contrast, when two of those four factors are present and do predominate, then the odds of the incumbent party losing 4+ Senate seats rises to 100%. Indeed, the median number of Senate seats lost when some combination of war, recession, realignment and scandal, are present, the White House party loses at least 8 Senate seats.
A few examples: while FDR added Senate seats in 1934 midterms, he lost 9 in 1938 midterms due to the combination of recession and scandal (trying to stack SCOTUS). 1942 and 1946 gave us war and recession to cost Democrats 8 and 12 Senate seats alike. 1950 gave us war again and scandals concerning the war costing Democrats 5 Senate seats. 1958 gave us recession and scandal, costing Ike 15 Senate seats. While JFK added Senate seats in 1962 and Nixon added Senate seats in 1970, only Watergate and stagflation in 1974 or the combination of Iran Contra and vulnerable class of 1980 incumbents cost the incumbent party 4 or more Senate seats until the realignment election of 1994, where evangelicals shifted their down-ballot voting to the GOP en masse. It took war and scandal in 2006 to see the Senate switch 4+ Senate seats again.
That’s the story of 2026: a very GOP favorable Senate map versus a very Democratic friendly election cycle. The GOP enters election season with all four factor present: war, recession/cost of living, realignment, and scandal. The Iran War was already deeply unpopular, and it’s impact on the economy in gas and diesel prices turns Americans sour on their current economic prospects, as wages fall behind, housing and health care feel increasingly unaffordable, labor force participation continues to drop, the the mirage of AI keeps the GDP just above a technical recession. The Epstein scandal remains one of the worst scandals in American political history, and Trump managed to associate himself deeply with the scandal in his handling of it. Then the realignment, as the new Trump 2024 voters joined the Obama-Trump converts of 2016 in abandoning GOP identity, already evident in surveys and primary participation.
A quintet of voter groups appear to be realigning away from the Republican brand — hispanic voters, black voters, industrial area voters, libertarian-leaning voters, and war-skeptical voters alike. This realigning electorate shows up disproportionately in key Senate contests. The war-skeptical voters in states like Maine, New Hampshire, Ohio, Michigan, Iowa, Montana, Nebraska, and Alaska (these are the states W failed to gain in between 2000 and 2004 due to the Iraq War before it even turned unpopular). The hispanic voters in states like Florida and Texas. The African-American voters in states like North Carolina and Georgia. The industrial voters in Ohio and Michigan. The libertarian leaving voters in states like New Hampshire, Alaska, Texas and Florida.
Thus, many of the states that seem “Safe” on the map are anything but, as their realigning electorates shift back against the Republican brand, with all of them having recent histories in electoral cycles of favoring Democrats or being true swing states. Take states like Florida and Texas where suburban margins began to erode for the GOP in the Trump era but countered that by massive margin shifts in hispanic and black precincts. Primary participation, voter identification, and public opinion surveys show those black and hispanic voters shifting back massively away from the GOP brand, which, given the erosion in some suburban areas and losses with younger generations, makes states Florida and Texas closer to competitive than double-digit leans.
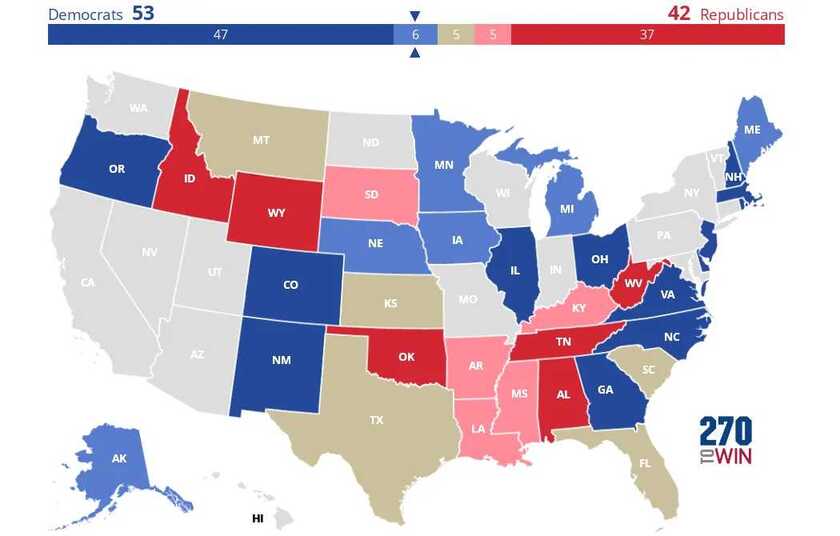
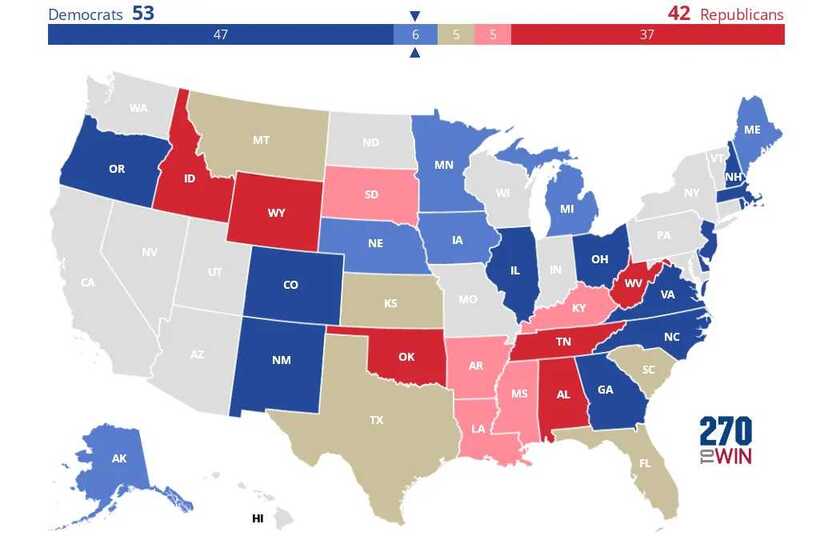
In big swing election cycles, even “safe” Senate seats can suddenly turn razor close, as Bob Dole found out in 1974, barely holding on to his Kansas seat before being the VP nominee two years later. Strong independent candidates in Kansas, Nebraska, South Dakota and Montana may pose a unique threat to GOP held seats, as the Nebraska race in 2024 showed, with Osborn running 17 points ahead of Harris’ margin in the state. Democrats field the much better candidate in Ohio with a proven track record of out-performing Democratic margins in the state, while the Texas GOP nominee faces abandonment from his own party after they spent over $100M bashing him in the state for a disliked party incumbent. Alaska primary results suggest the Democratic nominee already holds the edge in that ranked choice voting state, while the famed cross-over support for Collins in Maine appears to be fading with newer generations taking over the voter rolls. My current map would be as follows, with surprising closer-than-expected races in Montana, Kansas, Louisiana, Florida, Mississippi, South Dakota, South Carolina and Kentucky, and a median map of Democrats holding 53+ Senate seats after the 2026 elections.

If past is prologue, the map won’t save the GOP in 2026, and an ever bigger tsunami may be incoming than anyone in Washington expects.