SportsPicks
Politics • Investing & Finance • Sports
All your sports information for those investing Vegas-style in the outcomes of sports games. Predicting games against the line in all sports, especially football, American and English style.
Interested? Want to learn more about the community?
Crick's Picks: Super Bowl LVII - Eagles vs Chiefs

These are not Sportspicks "Recommended Picks"

  • Well guy's we finally made it!! Super Bowl LVII kicks off in just under 24 hours, and it's been an exciting ride all-season long. We are going to continue to bring you guy's a variety of content, throughout the year, on a wide range of Sports. We want to continuously get better at bringing you ALL of the best information available to give you an advantage over "The House". Always feel free to share any thoughts or ideas you may have that might help us provide you with a better product. We are here for YOU!! We want to give you the things that YOU want. I hope you guy's have enjoyed this season as much as I have, and I expect Super Bowl LVII to be the "Cherry on Top" for what has been a very fun 2022 NFL Season. From a gambling standpoint, we've had another solid year here at Sportspicks, and we're looking to cash in BIG on the Super Bowl!!

  • In this post, I'll give you my "Game Prediction", Offensive and Defensive Props, Kicker Props, Favorite "Longshot" Props, Captain's Mode Line-up, and my "Recommended" Same Game Parlay. I hope y'all enjoy this and hopefully we can have a HUGE Super Bowl Sunday!! Let's get to it!!

Super Bowl LVII: Chiefs vs Eagles

Game Prediction

  • Philadelphia wins the toss and defers to the 2nd Half. The Chiefs receive the opening kickoff, and go 3-and-out on their first drive. After a punt that results in a fair catch, The Eagles go 70 yards in 8 plays to take the early 7-0 lead. Jalen Hurts hits Dallas Goedert for a 14-yard TD, and Jake Elliott adds the extra point. Kansas City puts together a nice drive, but stalls out just outside of the Red-Zone. They're forced to settle for a 40-yard Harrison Butker Field Goal, making it 7-3 in favor of Philly early in the 2nd Quarter. The Eagles first drive of the 2nd Qtr starts at the 25-yard line, and they're able to go 75 yards in just 5 plays for the TD. Stretching their lead to 14-3 on a Hurts rushing TD from 3 yards out. The Chiefs answer right back, however, going 81 yards in 7 plays for their first TD of the game. Patrick Mahomes hits Marquez Valdes-Scantling on a 17-yard scoring strike, cutting the Philadelphia lead to 14-10. On the ensuing possession, the Eagles have their first 3-and-out of the game and punt it back to Kansas City with just under 3 minutes left in the 1st Half. The Chiefs manage to get into field goal range and close out the 1st Half on Butker's 2nd FG of the game, this one from 45 yards out. At the Half, Philadelphia leads Kansas City 14-13.
    The teams trade 3-and-outs on their first possessions of the 2nd Half. After a Kansas City Punt, the Eagles are able to get into Chief's territory, but the drive ends with a Turnover on Downs at the KC 40-yard line. Mahomes and crew take advantage, driving down the field to take their first lead of the game. Mahomes connects with Travis Kelce on a 24-yard TD pass, and its 20-14 Chiefs after Butker adds the extra point. With the Touchdown, Kelce breaks a tie with Rob Gronkowski for 2nd all-time in postseason TD receptions, catching his 16th playoff TD of his career, trailing only the great Jerry Rice. Philadelphia's struggles on offense continue on their next drive, as they go 3-and-out for the third time in the game. The Eagles get the stop from their defense on Kansas City's ensuing possession, but enter the 4th Qtr trailing 20-14. Only the fourth time Philly has trailed entering the 4th Qtr all season. Philadelphia gets a couple 1st downs on their next drive, but are again forced to punt around mid-field. It's an excellent punt, that goes out of bounds inside the 15-yard line. Mahomes goes to work, leading a 13-play 87 yard drive that chews up 8+ minutes of game clock. He finds Jerick McKinnon from 5 yards out for his 3rd TD pass of the game, and stretches their lead to 27-14 with just over 5 minutes remaining in the game. The Eagles HAVE to score quick, and they do!! Hurts leads his second 5-play 75 yard drive of the game. Hitting DeVonta Smith on a 19-yard TD pass, cutting their deficit to 27-21 after the extra point by Elliott. The drive takes just under two minutes, and they have all 3 timeouts left with three and half minutes to play. The Eagles get the stop they need when Brandon Graham sacks Mahomes on 3rd and 8, and Kansas City punts it back on the last play before the Two-Minute Warning. Philadelphia takes over at their own 18-yard line, trying to go 82 yards in 2:00 with no timeouts remaining. They once again get it into Chief's territory, but turn it over on downs for the second time in the game when Rookie George Karlaftis sacks Hurts on 4th and 9. Kansas City goes into "Victory" formation, with Game and League MVP Patrick Mahomes taking a knee to close it out. He becomes the 1st QB in NFL history to lead the league in passing yards and win the Super Bowl in the same season. Let the "Dynasty" talk begin!!

Final Score: Kansas City 27 Philadelphia 21

Crick's Picks

  • Chiefs +1.5

  • Chiefs ML

  • Chiefs/Eagles UNDER 51 Points

Game Props

  • Chiefs to win by 1-6 points +300

  • Both teams to score 20+ points -155

  • Neither team to score 30+ points +115

  • Eagles to score first TD and lose +380

  • Teams to score same amount of Total TD's +350

  • Game not tied again after 0-0 +110

  • Largest lead of the game UNDER 14.5 points -125

  • Eagles to score more points in 1st Half vs 2nd Half/OT +110

  • Eagles to score 1st TD -125

  • Chiefs 1st Score to be a FG +170

  • Eagles Team Total Points(1st Half) OVER 12.5 -125

  • Eagles Total FG's made (1st Half) UNDER 0.5 +140

  • Eagles Team Total Points UNDER 26.5 -115

  • Eagles OVER 0.5 TD's (1st Qtr) -120

  • Eagles OVER 6.5 Points (1st Qtr) +100

  • Eagles to win Race to 10 Points -125

  • Chiefs Team Total Points OVER 24.5 -110

  • Chiefs Total FG's made (1st Half) OVER 0.5 -180

  • Chiefs Total TD's (2nd Half) OVER 1.5 -130

Offensive Props

  • Jalen Hurts Anytime TD -110

  • Travis Kelce Anytime TD -135

  • Dallas Goedert Anytime TD +150

  • DeVonta Smith Anytime TD +150

  • Jerick McKinnon Anytime TD +180

  • Marquez Valdes-Scantling Anytime TD +225

  • Jalen Hurts OVER 1.5 Pass TD's -105

  • Patrick Mahomes OVER 25.5 Completions -135

  • Jalen Hurts UNDER 0.5 INT's -130

  • Patrick Mahomes Longest Completion UNDER 38.5 yards -120

  • Travis Kelce OVER 6.5 Receptions -175

  • Jerick McKinnon OVER 2.5 Receptions -145

  • DeVonta Smith OVER 5.5 Receptions +110

  • Kenneth Gainwell OVER 19.5 Rushing Yards -125

  • Boston Scott OVER 2.5 Rush Attempts +135

  • Patrick Mahomes first completed pass UNDER 10.5 Yards -140

  • Miles Sanders Longest Rush UNDER 14.5 Yards -125

  • Jerick McKinnon OVER 20.5 Receiving Yards -110

  • Noah Gray OVER 12.5 Receiving Yards -120

  • Kenneth Gainwell OVER 33.5 Rush+Receiving Yards -120

  • 1st TD Scorer to be Tight End +390

  • Shortest TD OVER 1.5 Yards +125

  • Each Team to score 1+ TD's in each Half -110

  • TD to be scored in every Quarter +100

  • 1st TD Scored to be OVER 8.5 Yards -110

  • 1st Points Scored Yardage to be UNDER 19.5 Yards -110

  • Eagles to Score TD on 1st Drive +195

  • Eagles to Score First -120

  • Total Offensive Yardage OVER 740.5 -110

  • Total 3rd Down Conversions OVER 11.5 -110

  • Total 4th Down Conversions UNDER 1.5 +130

  • Total Fumbles Lost UNDER 0.5 +175

Defensive Props

  • Brandon Graham OVER 0.75 Sacks +195

  • George Karlaftis OVER 0.75 Sacks +165

  • Josh Sweat OVER 0.75 Sacks +110

  • Eagles OVER 2.5 Sacks -140

  • Nick Bolton OVER 10.5 Tackles + Ast -115

  • Kyzir White OVER 6.5 Tackles + Ast +100

  • Eagles to Record 1st Sack -115

  • 1st Sack of Game to be recorded in the 1st Qtr +110

  • Total Game Sacks UNDER 5.5 -120

Special Teams Props

  • Jake Elliott UNDER 1.5 FG's Made -125

  • Jake Elliott OVER 2.5 PAT's Made -110

  • Harrison Butker OVER 7.5 Kicking Points -125

  • Chiefs OVER 1.5 FG's Made +100

  • Eagles Total FG Yardage UNDER 56.5 -110

  • Total FG Made UNDER 2.5 +150

  • Total FG Made (1st Qtr) OVER 0.5 +100

  • Total FG Made Yardage UNDER 109.5 -110

  • 1st Successful FG Made OVER 37.5 Yards +100

  • 1st Punt of Game will be a Fair Catch +230

  • Chiefs to be 1st team to Punt -120

  • Eagles Longest Punt UNDER 52.5 Yards +100

  • Eagles to Record Most Punts +150

  • Total Punts OVER 7.5 +140

Favorite Longshots (+800 or worse)

  • There will be a Fake Punt or Fake FG in the Game +3500

  • Defensive Lineman to win MVP +2500

  • Linebacker to win MVP +2800

  • Josh Sweat to Record 1st Sack of Game +800

  • Dallas Goedert 1st TD Scorer +1100

  • DeVonta Smith Last TD Scorer +1100

  • Chauncey Gardner-Johnson to make 1st INT of Game +800

  • Chiefs to win Game 27-21 +7500

  • Chiefs to win by exactly 6 Points +1000

  • Exactly 48 Points scored in Game +3000

Free SGP (7 Picks)

  • Travis Kelce Anytime TD

  • DeVonta Smith Anytime TD

  • Chiefs +1.5

  • Patrick Mahomes 25+ Completions

  • Kenneth Gainwell OVER 19.5 Rushing Yards

  • DeVonta Smith 6+ Receptions

  • Josh Sweat 1+ Sacks

Total Odds Boost = +4500

10.00 to win 450.00

DFS Captain's Mode Line-Up (50,000 Salary Cap)

Teams are comprised of a "Captain" and five (5) other "Flex" Players for a total of 6 Players. Your Captain earns 1.5x Points, but will cost 1.5x Salary

  • Captain - Patrick Mahomes 16,500

  • Flex - Harrison Butker 4,000

  • Flex - Kenneth Gainwell 5,000

  • Flex - Dallas Goedert 6,400

  • Flex - Jalen Hurts 11,200

  • Flex - Jerick McKinnon 6,800

Total Combined Salary Cap = 49,900

Good Luck and Enjoy the Game!!!!

-Crickett

Interested? Want to learn more about the community?
What else you may like…
Videos
Podcasts
Posts
Articles
Barnes Brothers: European Soccer MEGA Preview
01:08:49
Barnes Brothers: World Cup Final Preview
00:46:09
World Cup Final Preview: Barnes Brothers

Enjoy before the big finale on Sunday.

00:46:09
SEC Preview Podcast

A full breakdown of every team in the SEC, including talent analysis, coordinator concern, and schedule forecasts, with win total expectations. Enjoy!

SEC Preview Podcast
Smokehouse Mike's NCAAB

March Madness final four recap and Championship preview...

Smokehouse Mike's NCAAB
Smokehouse Mike's NBA
Live Chat
LIVE CHAT FOR 2026

Now open!

September 06, 2026
OFFICIAL PICKS REPORT: August 2026

A very profitable August across all markets. Let's keep it rolling...

AUGUST ROI: +52%
ANNUALIZED ROI: + 621%

2026_-_August_2026.pdf
Crick's Corner: Episode 244 "On To Week 2!!" (9/7/26)

ANY PICKS MADE IN THIS SHOW ARE NOT SPORTSPICKS "OFFICIAL PICKS"

START TIME - IMMEDIATELY FOLLOWING SMES

placeholder
post photo preview
Forecasting the Senate in 2026

Two conflicting trends dictate the Senate outcome in 2026. The map heavily favors Republicans, as the competitive Senate seats up lean heavily Republican. By contrast, the election context heavily favors Democrats, with war, recession, realignment and scandal tipping in their direction. A deeper dive reveals why prediction markets still likely undersell Democratic prospects.

First, the idea that Senate midterms favor the party out of power in the White House is belied by both recent and a century of history of Senate elections. Unlike the House, only a third of Senate seats face election in any midterm, and that map dictates outcomes unless the election context is particularly bad for the incumbent party.

Consider that the highly unpopular Biden didn’t lost any net Senate seats in 2022 and Trump added Senate seats in the Democratic friendly cycle in 2018. Equally, Clinton didn’t lose net Senate seats in 1998 nor did W. in 2002. Even low-approval election cycles like 1966 and 1982 didn’t produce a big swing in the Senate. Indeed, since 1934, the party in power only lost 10% or more of their Senate seats (4+) less than half of the time. Democrats need a flip of exactly that — at least 4 Senate seats — to retake power in the Senate.

Then take a look at the map, and you can see the reason for optimism in GOP circles and some traders in the prediction markets. Only 2 GOP-held seats are in states Trump won by less than double digits, while 2 Democratic-held seats are in states Trump won, and one of those GOP held seats features a long-time incumbent who typically runs double-digits ahead of the GOP norm (Collins in Maine). This is why the GOP entered the year believing odds of losing the Senate were remote, and the prediction markets mostly concurred.

But this ignores the counter-trend: the degree of election dismay with the incumbent party in the White House, and the reasons for that dismay. Presidential job approval has not been a neat proxy for Senate midterms because it depends on the reason for that dissatisfaction in the electorate. Four factors drive Senatorial midterms: war, recession/cost of living, realignment, and scandal. When two of those four factors are not present and don’t dominate, then the incumbent party’s odds of losing 4+ Senate seats drops to less than 20%. By contrast, when two of those four factors are present and do predominate, then the odds of the incumbent party losing 4+ Senate seats rises to 100%. Indeed, the median number of Senate seats lost when some combination of war, recession, realignment and scandal, are present, the White House party loses at least 8 Senate seats.

A few examples: while FDR added Senate seats in 1934 midterms, he lost 9 in 1938 midterms due to the combination of recession and scandal (trying to stack SCOTUS). 1942 and 1946 gave us war and recession to cost Democrats 8 and 12 Senate seats alike. 1950 gave us war again and scandals concerning the war costing Democrats 5 Senate seats. 1958 gave us recession and scandal, costing Ike 15 Senate seats. While JFK added Senate seats in 1962 and Nixon added Senate seats in 1970, only Watergate and stagflation in 1974 or the combination of Iran Contra and vulnerable class of 1980 incumbents cost the incumbent party 4 or more Senate seats until the realignment election of 1994, where evangelicals shifted their down-ballot voting to the GOP en masse. It took war and scandal in 2006 to see the Senate switch 4+ Senate seats again.

That’s the story of 2026: a very GOP favorable Senate map versus a very Democratic friendly election cycle. The GOP enters election season with all four factor present: war, recession/cost of living, realignment, and scandal. The Iran War was already deeply unpopular, and it’s impact on the economy in gas and diesel prices turns Americans sour on their current economic prospects, as wages fall behind, housing and health care feel increasingly unaffordable, labor force participation continues to drop, the the mirage of AI keeps the GDP just above a technical recession. The Epstein scandal remains one of the worst scandals in American political history, and Trump managed to associate himself deeply with the scandal in his handling of it. Then the realignment, as the new Trump 2024 voters joined the Obama-Trump converts of 2016 in abandoning GOP identity, already evident in surveys and primary participation.

A quintet of voter groups appear to be realigning away from the Republican brand — hispanic voters, black voters, industrial area voters, libertarian-leaning voters, and war-skeptical voters alike. This realigning electorate shows up disproportionately in key Senate contests. The war-skeptical voters in states like Maine, New Hampshire, Ohio, Michigan, Iowa, Montana, Nebraska, and Alaska (these are the states W failed to gain in between 2000 and 2004 due to the Iraq War before it even turned unpopular). The hispanic voters in states like Florida and Texas. The African-American voters in states like North Carolina and Georgia. The industrial voters in Ohio and Michigan. The libertarian leaving voters in states like New Hampshire, Alaska, Texas and Florida.

Thus, many of the states that seem “Safe” on the map are anything but, as their realigning electorates shift back against the Republican brand, with all of them having recent histories in electoral cycles of favoring Democrats or being true swing states. Take states like Florida and Texas where suburban margins began to erode for the GOP in the Trump era but countered that by massive margin shifts in hispanic and black precincts. Primary participation, voter identification, and public opinion surveys show those black and hispanic voters shifting back massively away from the GOP brand, which, given the erosion in some suburban areas and losses with younger generations, makes states Florida and Texas closer to competitive than double-digit leans.

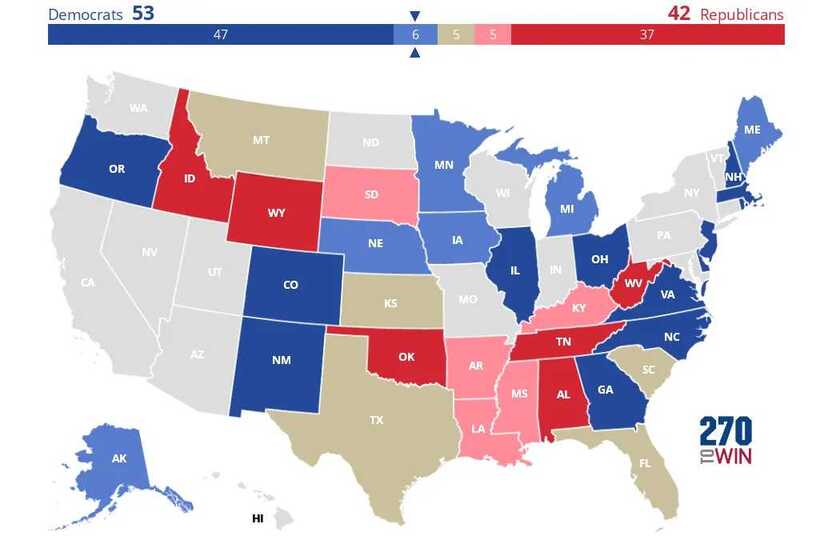
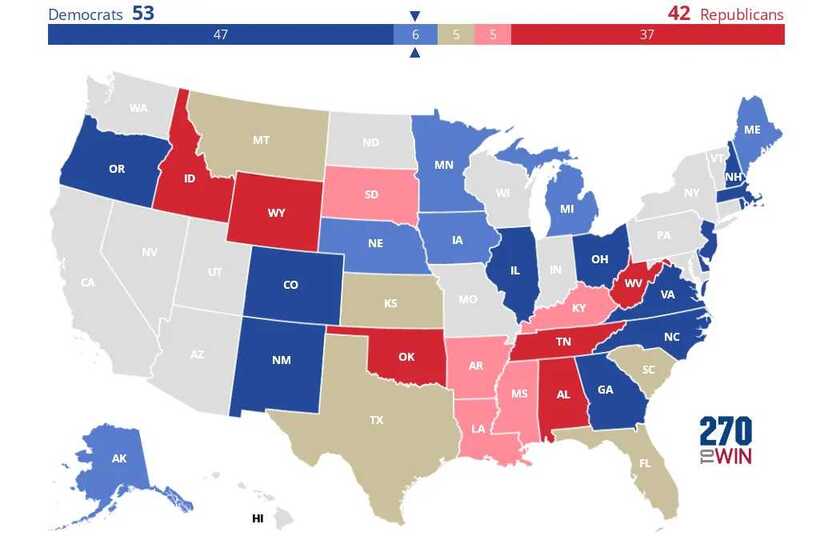
In big swing election cycles, even “safe” Senate seats can suddenly turn razor close, as Bob Dole found out in 1974, barely holding on to his Kansas seat before being the VP nominee two years later. Strong independent candidates in Kansas, Nebraska, South Dakota and Montana may pose a unique threat to GOP held seats, as the Nebraska race in 2024 showed, with Osborn running 17 points ahead of Harris’ margin in the state. Democrats field the much better candidate in Ohio with a proven track record of out-performing Democratic margins in the state, while the Texas GOP nominee faces abandonment from his own party after they spent over $100M bashing him in the state for a disliked party incumbent. Alaska primary results suggest the Democratic nominee already holds the edge in that ranked choice voting state, while the famed cross-over support for Collins in Maine appears to be fading with newer generations taking over the voter rolls. My current map would be as follows, with surprising closer-than-expected races in Montana, Kansas, Louisiana, Florida, Mississippi, South Dakota, South Carolina and Kentucky, and a median map of Democrats holding 53+ Senate seats after the 2026 elections.


If past is prologue, the map won’t save the GOP in 2026, and an ever bigger tsunami may be incoming than anyone in Washington expects.

Read full Article
post photo preview
OFFICIAL PICKS: Midterms, 2026
House Elections Projections
 
The House tends to be more responsive to midterm dynamics, but, like the Senate, swings hard in elections where some combination of the Four Factors are present -- cost of living crisis or recession; war; major scandal; betrayal or down-ballot realignment. A fun map to use is this simulator, which takes partisan averages from existing models, and plugs in the map based on your adjustment of the generic ballot edge for one party or another. https://globalelectionsimulator.com/#/usa-house
 
Historic Norms: When a combination of the Four Factors are present, this is the kind of swing you get:
1930: 52 seat swing
1946: 55 seat swing
1958: 49 seat swing
1974: 49 seat swing
1994: 54 seat swing
2006: 31 seat swing
 
2026 PROJECTIONS


Only for Supporters
To read the rest of this article and access other paid content, you must be a supporter
Read full Article
post photo preview
Barnes Betting Report: Senate 2026

First, four factors dictate whether there is major turnover in the Senate in a midterm election independent of the favorability of the Senate map (due to only one-third of seats being up in any given midterm). Often, as was the case in both 2018 and 2022, is that incumbents are not destined to lose seats, outside of realigning elections in unfavorable maps. This cycle's map favors the GOP, which is why the prediction markets and most forecasters expect a GOP majority in the 2027 Senate. The four factors that prove dangerous to the incumbent party are: first, a recession or cost of living crisis; second, a war; third, a major scandal; and fourth, a sense of betrayal in the voter group that backed the incumbent amongst some portion of their prior electoral coalition. Five midterms feature some combingation of those factors in some significant degree: 1930, 1946, 1958, 1974 and 2006.

Without those factors present in multiple forms, the incumbent party can expect to hold on to seats in states it previously won outside the national margin. When those factors are present, the landscape shifts dramatically. Examining those White House incumbent seats that showed a state-wide election decided by single digits in the prior decade produces the following probabilities: the incumbent White House party lost at least 67% of its incumbent held seats, as much as 85% of its incumbent held seats, and an average of 75% of its incumbent hold seats, rarely upsetting the opposition party in any seat and often losing a surprise or two in seats considered completely safe. 


Only for Supporters
To read the rest of this article and access other paid content, you must be a supporter
Read full Article
See More
Available on mobile and TV devices
google store google store app store app store
google store google store app tv store app tv store amazon store amazon store roku store roku store
Powered by Locals