



My system traditionally favors QB rankings as the primary basis for the power ratings. I may be shifting that a bit this year, but wanted to see what folks thought of these QB ranking. I consider the following good QBs, while any team not listed has an estimated average QB. Let me know what y'all think.
RAMS-STAFFORD
KC - MAHOMES
BUF -ALLEN
BAL -JACKSON
CIN - BURROW
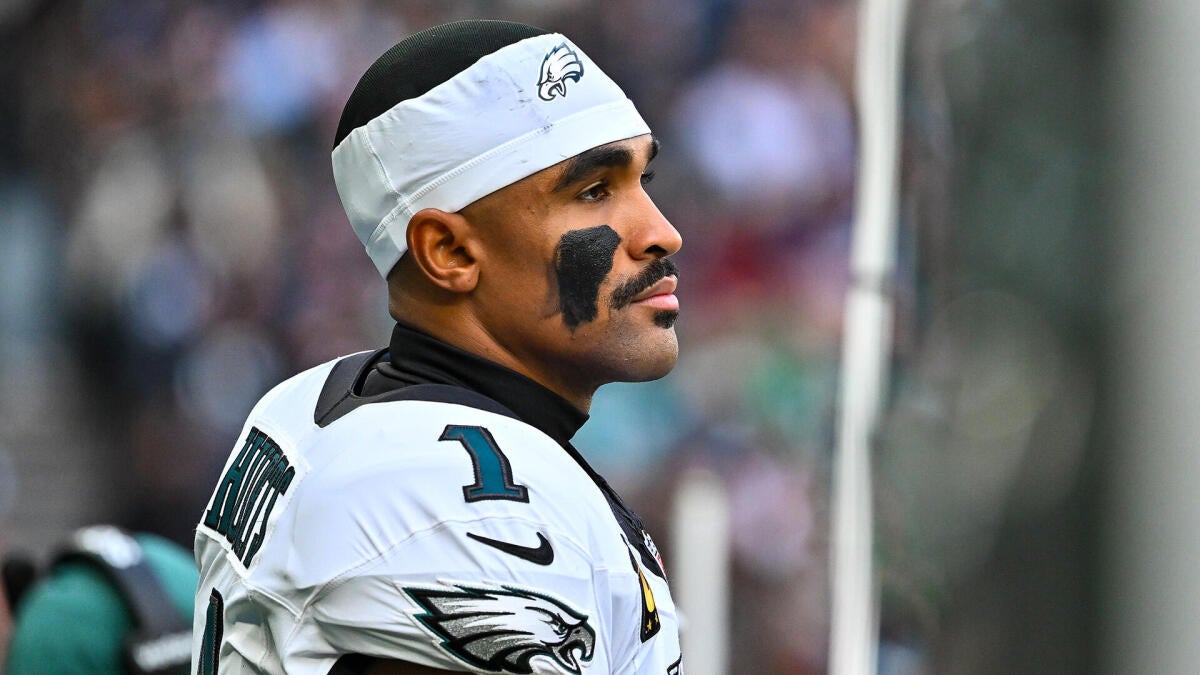
PHI - HURTS
WAS - DANIELS
DET- GOFF (new OC)
SF - PURDY
GB - LOVE
LAC - HERBERT
DAL - PRESCOTT
NE - MAYE
JAX - LAWRENCE
PIT - RODGERS (new OC)
IND - JONES (creative OC)
TB - MAYFIELD (creative OC)
HOU - STROUD
LV - COUSINS (Kubiak offense)
MN - MURRAY (good QB coach)
🔥 July 26, 2026 Degenerate Special 🔥
Afternoon & evening slate locked with high-K arms! 🔥
Your Locked Open Bets (placed & pending):
1. 3-Leg Parlay — Odds: -110
• Jacob Misiorowski 7+ Strikeouts (-430) — COL Rockies @ MIL Brewers 2:11 PM ET
• Jacob deGrom 6+ Strikeouts (-400) — SEA Mariners @ TEX Rangers 2:36 PM ET
• Cristopher Sanchez 6+ Strikeouts (-410) — NYY Yankees @ PHI Phillies 7:21 PM ET
#MLBProps #StrikeoutBets #DegenerateMode 🤑⚾
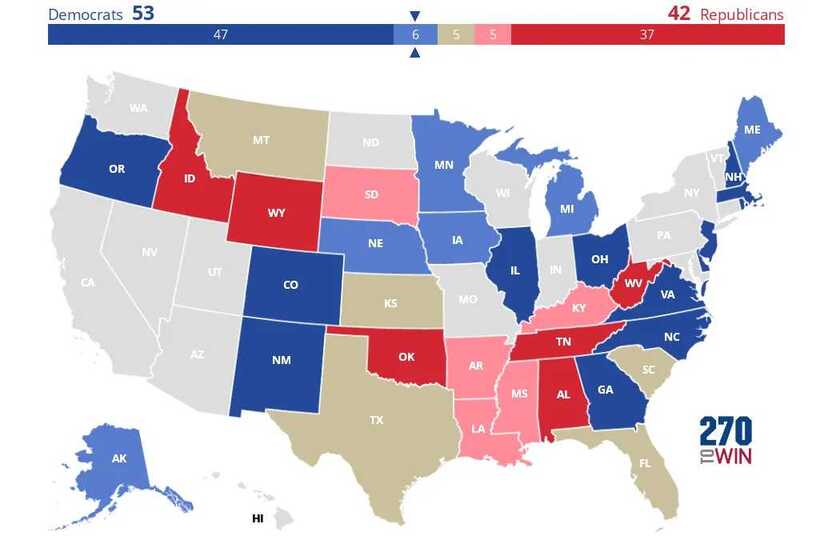
First, four factors dictate whether there is major turnover in the Senate in a midterm election independent of the favorability of the Senate map (due to only one-third of seats being up in any given midterm). Often, as was the case in both 2018 and 2022, is that incumbents are not destined to lose seats, outside of realigning elections in unfavorable maps. This cycle's map favors the GOP, which is why the prediction markets and most forecasters expect a GOP majority in the 2027 Senate. The four factors that prove dangerous to the incumbent party are: first, a recession or cost of living crisis; second, a war; third, a major scandal; and fourth, a sense of betrayal in the voter group that backed the incumbent amongst some portion of their prior electoral coalition. Five midterms feature some combingation of those factors in some significant degree: 1930, 1946, 1958, 1974 and 2006.
Without those factors present in multiple forms, the incumbent party can expect to hold on to seats in states it previously won outside the national margin. When those factors are present, the landscape shifts dramatically. Examining those White House incumbent seats that showed a state-wide election decided by single digits in the prior decade produces the following probabilities: the incumbent White House party lost at least 67% of its incumbent held seats, as much as 85% of its incumbent held seats, and an average of 75% of its incumbent hold seats, rarely upsetting the opposition party in any seat and often losing a surprise or two in seats considered completely safe.